How Big Data is Architecting India’s Biometric Identity System, Aadhaar

The most ambitious project of India, Aadhaar project relies completely on Big Data. From collection of data to storage and utilization of biometric information of the entire population, big data till date has crossed over the billion mark. It is needless to say, a project of such a vast magnitude must be plagued with ample challenges but as its powered by big data, the chances of success is high.
Basically, Aadhaar is a unique 12 digit number assigned by the UIDA, Unique Identification Authority of India to an individual residing in India. The project was launched in the year 2009 under the supreme guidance of former Infosys CEO and co-founder Nandan Nilekani. He was the sole architect of this grand project, which required several added inputs from various other sources.

MapR, a business software company headquartered in California is providing technology support for the most-ambitious Aadhaar project. It is the developer-cum-distributer of “Apache APA +0.00% Hadoop” and for quite some time it is optimizing its well-integrated web-scale enterprise storage and real-time database tech for this project.
The encompassing technology architecture behind Aadhaar is structured on the principles of openness, strong security, linear scalability and vendor neutrality. The system is expected to expand with every new enrollment, which means it’s required to handle millions of transactions through billions of records, each day.
To continue reading, click the link – https://www.dexlabanalytics.com/blog/the-role-of-big-data-in-the-largest-database-of-biometric-information
For big data courses, look no further than DexLab Analytics. It’s one of the best data analyst training institutes in Gurgaon.
The Only Prerogative to Combat Ransomware is Predictive Analysis
Things are not at all going right in the technological sphere. The domain is shrouded under the dark haze of WannaCry Ransomware this weekend. After the relaxing weekend, the Monday morning situation could never have been worse. The figures revealed on Monday evening by the Elliptic, a Bitcoin forensics firm, affirmed with the duty of keeping a close watch, confirmed a digit of $57,282, 23 shelled out to the hackers of Ransomware malware attack, who took over innumerable amount of computers worldwide on Friday and over the weekend.

The recent past has been witnessing the unprecedented malware attack across 150 countries. The current picture describes more than 200000 systems around the world being affected and the loss of tons of data.
Also read: How To Stop Big Data Projects From Failing?
A few years back also, Ransomware was unheard of and today it has emerged as one of the major issues of concern. So, what is the solution now? Several veteran data scientists and the honchos of the technological world have voted for Predictive Analysis as the ultimate solution for destroying Ransomware.
With the conventional cyber defense mechanisms at a backseat, Predictive Analysis defense technology remains the ultimate resort for any organization. The Predictive Analysis is mainly dependent on instituting a pattern of life within the enterprise and saving from disgruntling malware and similar disturbing activities.
Also read: What Sets Apart Data Science from Big Data and Data Analytics
Paul Brady, the CEO of Unitrends, explained the procedure where the backup system uses the tools of machine learning to identify and understand that certain data anomalies indicate the threat of a Ransomware attack.

So the above mentioned description clearly depicts the many advantages of Predictive Analysis. Now, the sad part of the story remains, that the difficulty in management remains the major blockage for the employment of this method. Let’s hope for the best and wait for the day when Predictive Analysis would be the only possible solution. Till then gather information on SAS predictive modeling training in Pune and Gurgaon only at www.dexlabanalytics.com
Get Acquainted With Your Daily Dose of Big Data Analytics

What is trending in the technical world? Big Data is the word. The sudden upsurge witnessed in the IT Industry has equivalently led to the emergence of Big Data. The complexities of the Data sets are extremely troublesome to co-ordinate activities with the usage of on-hand database management tools. Hence, the shift to this catchy phrase, dealing with homogenous amount of data and is of uttermost importance. Let’s have a quick tete-a-tete with this newest branch of science i.e. Big data Analytics.
Also read: Big Data Analytics and its Impact on Manufacturing Sector
- A for A/B Testing– A very essential element of web development and big data industry, it is a powerful evaluation tool to decide which version of an app or a webpage is extremely effective to meet the future business goals. Also, this decision is taken carefully after comparing the numerous versions to select the best from the rest.
- Set the standards for Associate Rule learning– The structure enlists a set of technique in the quest for interesting relationships or the ‘association rules’ amidst variables in massive databases. For better understanding refer to the flowchart attached in the blog, describing a market analysis by a retailer, assuming the products which are high on demand and the usage of this data for successful marketing.
- Get a better understanding of Classification Tree Analysis-In clearer terms, it is the method of recognizing the category in which the new observation falls into. Statistical Classification mainly implements to:
- Classification of organisms into groups.
- Automatically allocating documents into categories.
- Creating profiles of students enrolling for the online courses.
PS: For the better understanding, take a quick glance at the illustration attached below.
Also read: What Sets Apart Data Science from Big Data and Data Analytics
- Why would you opt for Data Fusion and Data Integration? The answer is simple. The blending of data from multiple sensors, data integration and fusion leads to the total accuracy and direct more specific inferences which otherwise wouldn’t have been possible from a single sensor alone.
- Mingling with Data Mining – To be precise, Data Mining is nothing but the collective data extraction techniques to be performed on a large chunk of data. The parameters include Association, Classification, Clustering and Forecasting.
- The cloning of Neural Networks- This includes Non-Linear predictive models for pattern recognition and optimization.
This was a quick introduction to the world of Big Data Analytics. With this get to know more about the Big data certification course in Pune only by logging at www.dexlabanalytics.com.
Interested in a career in Data Analyst?
To learn more about Machine Learning Using Python and Spark – click here.
To learn more about Data Analyst with Advanced excel course – click here.
To learn more about Data Analyst with SAS Course – click here.
To learn more about Data Analyst with R Course – click here.
To learn more about Big Data Course – click here.
How to Connect Oracle BI Server with Tableau

Here, we will discuss about how to incorporate Oracle BI server and make use of the existing Subject Areas built on RPD in Tableau desktop workbook as Data Source.
NOTE: This is applicable for 8.2, 8.3, 9.0 and later versions.
Firstly, to launch an ODBC connection with the Oracle BI Server to access RPD Online, you have to install a copy of Oracle Business Intelligence Developer Client Tools (available from the Oracle website). Following, you can use the same DSN to connect to Tableau through ODBC connections.
As soon as you are done with installing the client, carry out the following steps to create a database source name (DSN):
- Follow the steps mentioned below to add a new system DSN for Oracle BI Server ODBC in the ODBC Administrator tool..
- Go to the System DSN tab and click Add
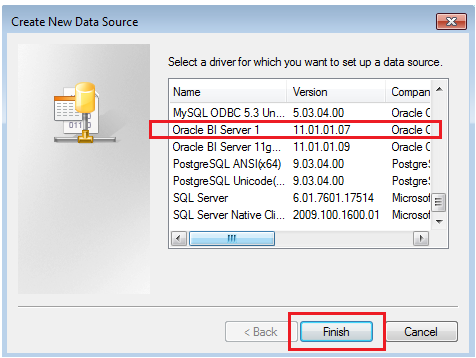
- Choose the Oracle BI Server DSN, among other available drivers
- Give correct connection details and connect to BI Server
3. Save the System DSN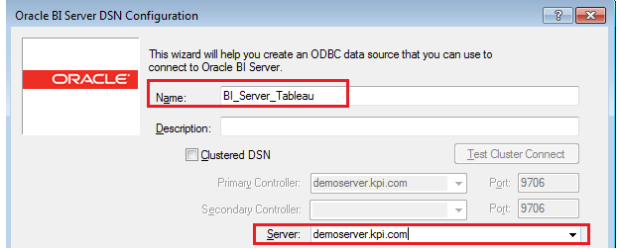
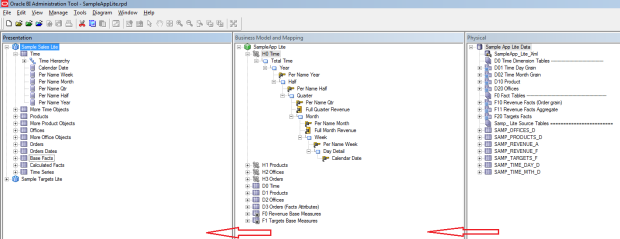
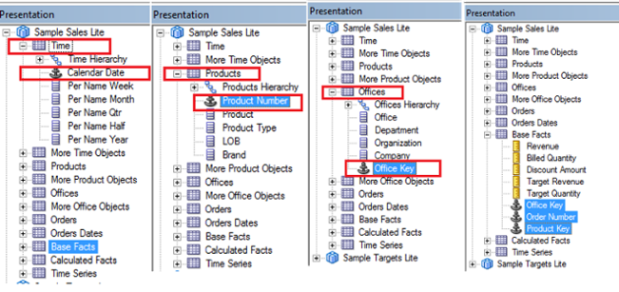
In total, there are 3 levels in RPD:- Physical Layer (right pane) – This is the layer where a connection is established between each data source and the raw tables are disclosed. Joins across tables are performed here.
- Business Layer (middle pane) – This is where logical relations, data modelling and hierarchy development are implemented.
- Presentation Layer (left pane) – This is the layer exposed to the business through “subject areas”. The subject areas are clearly modelled to display data in the most easy-to-understand format.
Under Tableau, tables in the presentation layer are adjoined as data sources, only.
Locate the Key Fields in Dimensions and Fact Table in Physical Layer of RPD and disclose the same to respective Presentation Tables in Presentation Layer of Sample Sales Lite Subject Area.
Create a “.tdc” fileCreate a Tableau data source customization (.tdc) file to connect Tableau Desktop to an Oracle BI server.
- Open a text editor; copy and paste the below code onto it:
<connection-customization class=’genericodbc’ enabled=’true’ version=’9.3′><vendor name=’Oracle Business Intelligence’ />
<driver name=’Oracle BI Server 1′ />
<customizations>
<customization name=’CAP_SET_ISOLATION_LEVEL_VIA_ODBC_API’ value=’no’ />
<customization name=’CAP_SUPPRESS_DISCOVERY_QUERIES’ value=’no’ />
<customization name=’SQL_CATALOG_USAGE’ value=’0′ />
<customization name=’SQL_SCHEMA_USAGE’ value=’0′ />
<customization name=’CAP_FAST_METADATA’ value=’yes’ />
</customizations>
</connection-customization>Nota bene: Version is crucial; adjust the version with that of your Tableau desktop version. In my case, it is 9.3.

Recently, credit risk analysis course in Noida is attracting a lot of attention. If you are looking for an exhaustive credit risk analysis course in Delhi, log into DexLab Analytics. You will surely get what you need!
- Give correct connection details and connect to BI Server
From dreams to reality: a vision to train the youngsters about big data analytics by the young entrepreneurs:

There is a famous saying that a life without any goal is a ship without radar. This saying was actually internalized by the two young Noida based entrepreneurs, Vivek Debuka and Subhrajyoti Adhikary. Thus, Dexlab Analytics, their brain child was born; with the vision of educating young minds regarding big data analytics skills.

According to Mr.Debuka, the CEO and one of the leading figures behind Dexlab Analytics, their thought was of a different yet needful pattern. With the analytics training institutions placed in Gurgaon, Pune and Noida, it was an endeavor to make the country realize about the driving force i.e. the data. Name any kind of work like HR, Management, and Sales or marketing, all have its source in the data analytics. Thus, they are the believers in ‘business is where data lies’.
They believe that Indian education system have rich resources, like, talented and well – read professors and intelligent students .Yet, the lack of a bridge to connect the two is felt. Thus, DexLab has its list of field specific courses, to train young minds accordingly to the needs of the industry. People interested for a career in analytics are trained extensively in SAS, while those in the field of visualization try to grasp Tableau.
Dexlab’s Datacember is another awareness campaign created exclusively for the college students, filled with discounts.
The founders had the idea, but not the proper knowledge to execute it. So, the journey was not a bed of roses. They could actually sense failure when the turning point came hand in hand with the extremely talented and hardworking consultants at Dexlab Analytics. The gems in the crown include consultants from various educational backgrounds and working professionals from companies like Genpact, Bajaj ,HDFC , to name a few .
The owners are very much confident about their idea- ‘data is here to stay’. So, after Gurgaon they have extended their Machine Learning Certification to Noida. They have their simple yet planned economic motto: to earn, save and invest. DexLab tries to keep it as a value oriented aspiration for yielding better results. They are believers that all the future jobs are data driven and this belief pushes them to spread data literacy.

Dexlab’s Datacember is a Special Christmas Gift for College Students

DexLab Analytics is quite a reputable name in the sector of data analytics trainings in India. They are also known for their online live training courses and for their unique offerings of free demo sessions. With data science and analytics being deemed as the sexiest job in the 21st century, it only makes sense that it gathering a lot of attention from young and ambitious youth ready to start their careers.
Until now the field of analytics training was mostly known for people with preliminary or specialized degrees. But DexLab Analytics with their latest winter admission offer called – DexLab’s Datacember is hoping to change that trend. They believe that analytics training should be started from the very beginning of professional education, as the subject is highly complex and needs practice.
DexLab’s #Datacember
They are trying to entice the students with this new promotional admission offer to make the career of data analytics seem lucrative and with a lot of scope for success, which is the fact in the present market. The admission offer can be availed by students of colleges from any relevant fields and will only require the furnishing of a student ID. The courses on which the offers are applicable are the following Business Analyst Certification, Data Science, Big Data Hadoop for Classroom Training only at Gurgaon & Pune.
The offer up for grabs in DexLab’s Datacember drive is that for a single entry of a student, a discount of 10% can be availed on the course fees; but for entry of students 3 or more a discount of 30% each on the admission fees can be obtained.
The date of registration for this offer is from 7th December 2016 to 14th January 2017. The Datacember offer will remain valid for December 2016 to March 2017.
The CEO of DexLab spoke on this initiative by saying, “In light of the same the institute has launched DexLab’s Datacember – a campaign which offers to provide college students with attractive discounts to help them acquire these talents easily.”
Furthermore, the institute also plans to conduct corporate trainings and collaborate with their long-time training partners RCPL along with several hundreds of other colleges and Universities in India; for conducting workshops and corporate trainings on the topics related to data science and Big Data Analytics. This corporate training collaboration is dated to start from the 10th of December and will go on until the 18th December 2016. The training sessions will of 40 hours each and will cover the topics of R Programming, Analytics using R and Data Science.
The first training session is about to take place at an engineering college in Bhubaneswar, Orissa for their client RCPL.
About DexLab Analytics:
Founded by a team of core industry experts with several years of experience in the field of data science and analytics, their institute has been around since the beginning of the Big Data buzz. They are a reputable institute based in Gurgaon and Pune who are known for quality training and placement support for their students.
Contact Details:
DexLab Solutions Corp.
G. Road, Gurgaon 122 002, Delhi NCR
+91 852 787 2444
+91 124 450 2444
DexLab Solutions Corp.
Gokhale Road, Model Colony, Pune – 411016
+91 880 681 2444
+91 206 541 2444
hello@dexlabanalytics.com
Having Soft Skills is Necessary for Success of Data Governance
For several years now, I have been associated with a company that enables individuals and organizations, implement Data Governance in their systems. An interesting thing that I have come across is that most people presume data governance to be a technical and analytical field. But the truth is, majority of data governance job roles are actually undertaken by business users. I have found out that most of the successful data governance schemes are run as change management initiatives, which are led and supported by the individuals who possess impeccable soft skills.
At the cost of penning clichéd words, things like passion, enthusiasm and the ability to persuade or motivate others to reap achievements for a goal, be it in Data Governance or any other major programme, will definitely work to stack the odds in your favour. For most of you reading this article, the subject of Data Governance may seem too dry and mundane to be passionate about, something that seems too mechanical and uninspiring. But have you ever thought of this, in this way:
If you do not buy, so won’t they!
And that is not a good news for any of the parties involved.
Having strong communication abilities is always a great asset to have. One may need to convince strangers and that too masses of them, influence them on an individual level, when making proposals of new approaches to governing data. History has it, that there is always resistance to change and having soft skills that can soften this blow of transformation, will be a great tool to manage that resistance and transform it into a positive direction.
So, for those who are working on a Data Governance initiative or aspire to work on some form of Data Analytics or Management field, and have a feeling that communication is not your forte. Then i recommend that you let a helpful hand learn it through proper coaching and practice. After all peering at large data sets does not help with social skills! That is definitely understandable. But you must have a strong orator hidden behind those ‘nerd’ glasses who can translate the complexities of data governance and analytics to the language of the commoners.
I strongly recommend that you use a pragmatic approach when implementing Data Governance and decide to apply the same for your soft skills training.
At whatever stage you are currently in your Data Governance and analytics journey do not forget that spending some time to focus on your soft skills will definitely have a significant contribution towards the success of your initiative.
You can learn more about Data Analytics and governance along with soft skill training at DexLab Analytics.
Big Data Analytics is The New Nostradamus of The 21st Century
The debate of US elections did rage on full swing before the shocking results were obtained and Donald Trump was elected the president. There were numerous people tweeting, blogging, and updating other social media platforms with their thoughts, and opinions. But all these were based on the data offered by the data researchers who had a rich source of information about what were the general view of the people about this infamous electoral race.
The power of data analytics is such now that an associate Prof Stantic was so confident about the results that he publicly announced his predictions including for the swing states, and what is more his predictions were right about them as well.
He stated on the issue by saying – “my algorithms showed clearly that based on previous patterns and sentiments in the social media about Trump, by the end of the November 8th would take a massive lead despite it only being a 10 percent chance to win as per all the polling surveys at the time.
He further added, “That a day before that in a public address I was even able to pinpoint the exact states where Trump would win like Florida, Pennsylvania, and North Carolina. Someone in the audience even challenged me by going online and checking the data that Hillary was the favorite of 84 percent.
To that all I have to say is people are more likely to be honest about their preferences when telling their friends and family and not just answering polls. It is almost nerve wracking that completely accurate predictions can be made using just social media analysis.”
Even other Big Data analytics specialists have been able to correctly predict the outcomes of the US Presidential elections 2016 much ahead of time. Griffith’s Big Data and Smart Analytics Lab analyzed simple twitter comments during the end of July and were able to predict that if the elections had taken place at the time, Trump would have been the clear winner over Clinton. The results were even shared at that time in an article by The Conversation.
The same analytics lab was able to predict using similar methods and publically announced that the coalition would win over ALP at the Australian federal elections.
Over the past several years presidential and political elections have proved to be ideal test beds for the social media analytics, big data researchers and data analysts which can offer great details on how even the campaign gain more insight about potential voters and try and win over more. “These analytics methods can offer much better insights that simple telephone polling, especially at a time when landlines are barely in use and everybody has a caller-ID”, said professor Stantic.
“And that is why polls leading up to the elections had such an inconsistent outcome.”
He further went on to speak about Big Data by saying – “The amount of information or data we generate is a truly staggering one and that is continuing to grow. This publicly available data is secret treasure-trove of useful information, for those who know how to use it right.”
Professor Stantic further stated that Big Data analytics is a discipline that is faced with numerous challenges that comes with managing the sheer amount of data that no one has noticed. Similar predictions await us for a better and smarter world, about environmental changes of the Great Barrier Reef on Human sensors, gold coast visitor satisfaction etc. which have already been done on projects funded by the National Environmental Science Program and the City of Gold Coast.”
“We can further improve the predictive power of Big Data Analytics as there is a growing need for better, smarter and faster algorithms to perform deep learning on humungous volumes of data, that are being drawn from diverse areas and we are working on it.”
Thus it is evident that Big Data training if made feasible for the right hands can help change the world into a data-driven, smart-opia!
Interested in a career in Data Analyst?
To learn more about Machine Learning Using Python and Spark – click here.
To learn more about Data Analyst with Advanced excel course – click here.
To learn more about Data Analyst with SAS Course – click here.
To learn more about Data Analyst with R Course – click here.
To learn more about Big Data Course – click here.
How to Write and Run Your First Project in Hadoop?

It may be easy to run MapReduce on small datasets without any fuss over coding and fiddling, but the only condition being you know what to do. And here is what you should know:
It may be already known to you that MapReduce works on a conceptual level. In this blog post we will discuss how you can write code that will run on Hadoop and that will start with a MapReduce program using Java.
The development environment:
To begin with we will need Java (we are using Oracle JDK 6), Git, Hadoop and Mit. You can download the latest stable version of Apache Hadoop (1.0.4) online from there release page, and then extract it to a place suitable for you.
This is what we did on our computer:
% tar zxf hadoop-1.0.4.tar.gz
% export HADOOP_HOME=$(pwd)/hadoop-1.0.4
% $HADOOP_HOME/bin/hadoop version
Hadoop 1.0.4
Then visit another directory and find the Git repository that compliments this article:
% git clone git://github.com/tomwhite/hadoop-drdobbs.git
% cd hadoop-drdobbs
% mvn install
You will find that this repository also has a small amount of sample data suitable for testing. Like this:
% cat data/*.tsv
dobbs 2007 20 18 15
dobbs 2008 22 20 12
doctor 2007 545525 366136 57313
doctor 2008 668666 446034 72694
The file has a few lines from the Google Books Ngram Dataset. For clarity here’s what they are: the first line has the word “dobbs” which appeared in the books from 2007 about 20 times almost and these occurrences were noted in more than 18 pages in 15 books.
Writing the Java MapReduce:
To find the total count for each word let us begin to write the MapReduce job. We will begin with the map function which in Java is represented with an instance of org.apache.hadoop.mapreduce.Mapper.
As a first step you must decide about the mapper is the types of the input key-value pairs and the output-key-value pairs. For the declaration of the Mapper class, here it is:
public class Mapper
As we are going to process the text, we will use the TextInputFormat. This will help us determine the input types, like LongWritable and Text, both of these are found in the org.apache.hadoop.io package. These types of Writables act as wrappers around the standard types in Java (in this case they are, long and string), this has been optimized for efficiency of serialization.
But authors of the MapReduce programs can use the Writable types without having to think about serialization. The only time they may need to consider serialization is when they write a custom Writable type. And when in such circumstances it is recommended to use a serialization library like Avro.
Coming back to the input type we can help present the input to our mapper with TextInputFormat as Longwritable, Text and pairs like this:
(0, “dobbs 2007 20 18 15”)
(20, “dobbs 2008 22 20 12”)
(40, “doctor 2007 545525 366136 57313”)
(72, “doctor 2008 668666 446034 72694”)
The key here is to use the offset within the file, and the content of the line is the value. As the mapper it is your job to extract the word along with the number of occurrences and ignore the rest. So, the output would be (word, count) pairs, of type (Text, LongWritable). The signature of the mapper should look like this:
public class ProjectionMapper extends Mapper
Then the only thing left for us to do is to write the implementation of the map() method. The source for the whole mapper class would appear in Listing One (ProjectionMapper.java).
Here’s what the Listing One: ProjectionMapper. Java looks like:
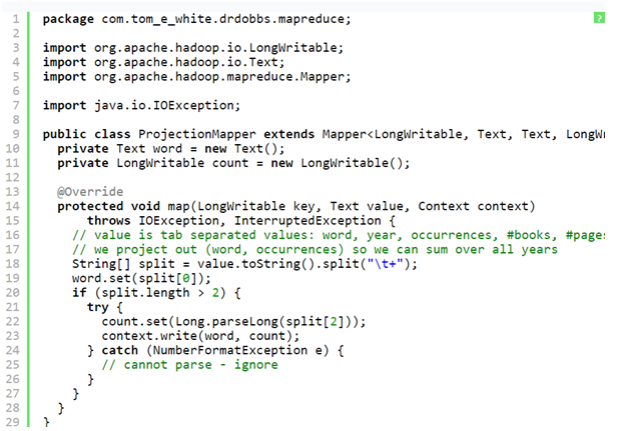
But there are certain things that one must know about this code.
- There are two instance variables, count and word which have been used to store the map output key and value.
- The map () method is known as once per input record, so it works to avoid unnecessary creation of objects.
- The map () body is pretty straightforward: it is used to split the tab-separated input line into the fields. It uses the first field as word and the third one as count.
- The map output is written with the use of the write method in the Context.
For the sake of simplicity we have built the code to ignore the lines with an occurrence field which is not a number, but there are several other actions one could take. However there are some other actions that one could take. For instance, incrementing a MapReduce counter to track how many lines are affected by it. To know more about this see, getCounter() method on Context for more information. After running through our small dataset, the map output would look like this:(“dobbs”, 20)
(“dobbs”, 22)
(“doctor”, 545525)
(“doctor”, 668666)
You must understand that Hadoop will transform the map output so that values can be brought together for a given key. The process is called the shuffle. For our abstract representation, the inputs or reducing the steps will seem somewhat like this:
(“dobbs”, [20, 22])
(“doctor”, [545525, 668666])
Most of our reduce implementation will have something to do with sum of the counts. We will require an implementation of the org.apache.hadoop.mapreduce. The reducer should be used with the following signature:
public class LongSumReducer extends Reducer<
Text, LongWritable, Text, LongWritable>
We can also try to write the code on our own, but with Hadoop we do not need to, as it comes with an implementation which is shown below in the Listing Two (LongSumReducer.java):
Listing two: LongSumReducer.java (code obtained from Apache Hadoop project) would look like this:
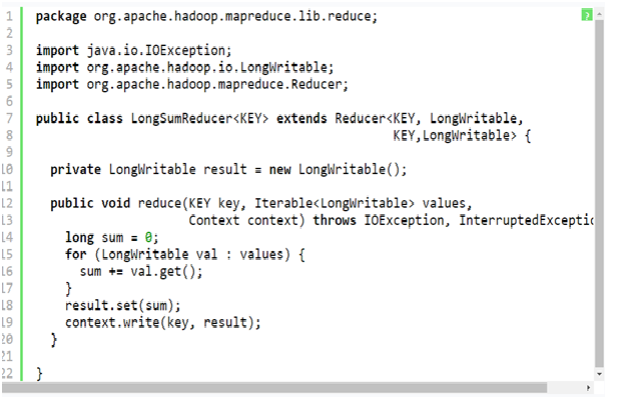
A noteworthy point to be mentioned here is, that reduce () method signature is slightly different from the map () one. That is because it contains an iterator over the values rather than just a single value. This will showcase the grouping that the framework would perform on the values for a key.
The implementation is fairly simple in the LongSumReducer: it sums the values and then writes the total out using the same key as the input.
The output for the reducer will be:
(“dobbs”, 42)
(“doctor”, 1214191)
This was the first part of this blog, for the rest of the step follow our next blog post from the premiere SAS training centre in Pune. In the next blog tranche we will reveal the procedures for the Listing three and the actual running of the job.
Interested in a career in Data Analyst?
To learn more about Machine Learning Using Python and Spark – click here.
To learn more about Data Analyst with Advanced excel course – click here.
To learn more about Data Analyst with SAS Course – click here.
To learn more about Data Analyst with R Course – click here.
To learn more about Big Data Course – click here.
You Must Learn Hadoop for These 5 Reasons

Industry insiders revealed that a Big Data Hadoop certification can make all the difference between having a dream job role and a successful career with being left behind. As per Dice all technology professionals should start volunteering for major Big Data projects which will make them more valuable to their present firms and also make them more marketable to other employers.
As per a Forbes report released in 2015, about 90 percent of global companies reported to have made medium to high levels of investment into Big Data Analytics and out of them about one third of the companies described their investments as highly important. Also about two thirds of these businesses reported that these analytics initiatives with Big Data have had a significant and measurable impact on their revenues.
People who have undergone Big Data Hadoop training are highly in demand and this is undeniable in today’s times. Thus, for IT professionals it is imperative to keep themselves abreast with the latest in trends in the Hadoop and other Big Data analytics technologies.
The main advantages with an Apache Hadoop certification to ramp your career can be summarised as the following:
- Accelerated career growth
- An increment in pay packages for having skills in Hadoop
So, it is evident that a career in Hadoop will pay well and is no rocket science.
Apache Hadoop courses offer increased job opportunities:
Assessing the Big Data market forecast the industry seems more than promising and the upward trends are clearly visible which is projected to keep progressing with time. It is safe to say that the job trend or a market phenomenon is not a short-lived feature. That is because Big Data and its technologies are here to stay. And Hadoop has the potential to improve job prospects for people whether they are fresher or an experienced professional.
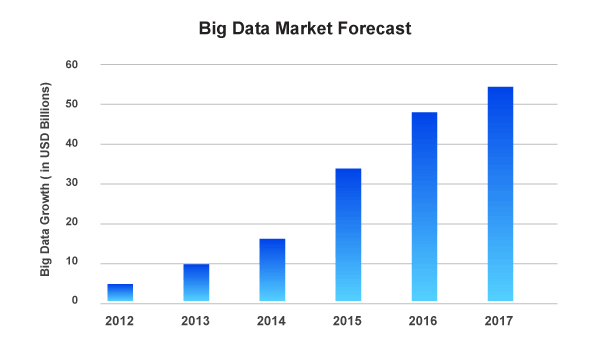
Big Data Market Forecast
Avendus Capital released a research report which estimates that the IT market for Big Data analytics in India is floating around USD 1.15 billion during the end of 2015. This contributed to about 1/5th of the KPO market which is worth USD 5.6 billion. Moreover, the Hindu made a prediction which suggests that by the conclusion of the year 2018, India solely will face with a shortage as close to 2 Lakh of Data Scientists. This should present the people with tremendous career and growth opportunities.
This huge skill gap within Big Data can be bridged only by efficient learning of Apache Hadoop which enables professionals and freshers alike to add value to their resumes with Big Data skills.
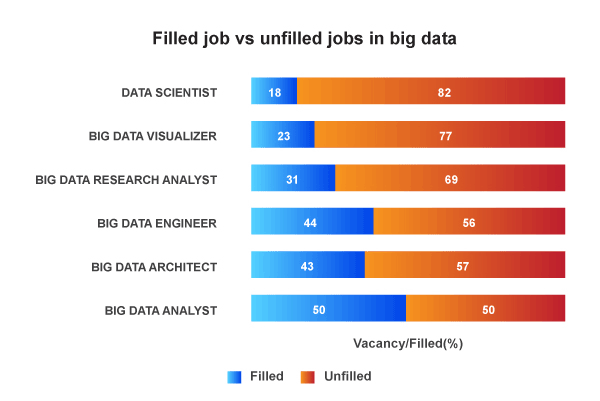
Filled Job VS Unfilled Jobs in Big Data Analyst
Thus, this is the perfect opportunity for you to take maximum advantage of a Big Data Hadoop course to reap the benefits of this positive market trend.
Who is employing Hadoop professionals?
The best place to get information on the number of existing Hadoop professionals and whose hiring is to go on LinkedIn. The graph displayed above talks about the titles of Hadoop professionals who are being hired by the top companies and which has the maximum vacancy ratio.
The word around the market is that Yahoo! is leading this rat race.
Big Data Hadoop will bring about the big bucks:
According to Dice, technology professionals should begin volunteering for the Big Data projects, which will make them more valuable to their current employing organization and make them more marketable to other employers.
Companies around the world are betting big that harnessing data can play a huge role in their competitive plans and that is leading to the high pay for their in-demand, critical skills.
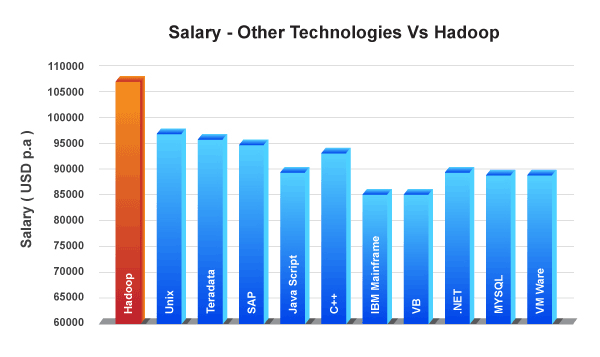
Salary – Other Technologies Vs Hadoop
As per the Managing Director of Dice, Hadoop is the leader in Big Data category in terms of job postings. And according to Dice, Hadoop professionals can make an average of USD 120,754 which is more than what Big Data jobs pay which is about USD 108,669.
Top companies that are hiring Hadoop pros:
Top Companies That are Hiring Hadoop Pros:
Interested in a career in Data Analyst?
To learn more about Machine Learning Using Python and Spark – click here.
To learn more about Data Analyst with Advanced excel course – click here.
To learn more about Data Analyst with SAS Course – click here.
To learn more about Data Analyst with R Course – click here.
To learn more about Big Data Course – click here.
